Adventures in Climate Change, Episode 5: Adding up greenhouse gases
Local Contributor
24 August 2025, 6:00 AM
 Photo: Darren Parlett
Ray Johnson
Welcome to first-time and regular readers. In Episode Four we looked at how the IPCC assessed the quality of a wide range of climate science using a combination of “confidence” and ‘likelihood” ratings.
This time we explore the quantity side of the anthropogenic drivers of climate change.
The human activities include “the burning of fossil fuels, deforestation, land use and land use changes (LULUC), livestock production, fertilisation, waste management, and industrial processes.”
These activities produce the ‘greenhouse’ gases that are our focus.
First, some concepts, drawn from the IPCC Glossary and the Working Group I (WGI) Sixth Assessment Report (AR6) Technical Summary:
Flux – a flow of matter, heat or energy – can be from one place to another or from one medium to another eg land to atmosphere, atmosphere to ocean.
Radiative forcing - “The change in the net, downward minus upward, radiative flux (expressed in Watts per square metre) due to a change in an external driver of climate change, such as a change in the concentration of carbon dioxide (CO2), the concentration of volcanic aerosols or in the output of the Sun.”
Effective radiative forcing (ERF) – after adjustment due to interactions of the flux through the atmosphere.
To recap on the basics: In a stable climate the incoming energy of the Sun (downwards) is balanced by the outgoing reflected sunlight and thermal radiation (upwards).
A positive ERF contributes to warming, and a negative to cooling. Well-mixed “greenhouse gases” are the most significant ‘positive’ drivers, mainly carbon dioxide and methane.
Sulphur Dioxide is the most significant cooling gas.
Having a common metric allows addition, comparison and further analysis, especially with regards to mitigation strategies (Working Group III).
To compile the quantitative data WGI assesses a wide range of radiative forcing studies.
WGI also looks at attribution studies, a complementary method, for increased confidence in the findings.
In AR6 WGI covered (in decreasing impact order): Carbon Dioxide, Methane, Other Greenhouse Gases, Ozone, Other Anthropogenic, Solar, Volcanic, Land Use and Aerosols.
Greenhouse gases can trigger feedback loops eg a warmer atmosphere can hold more water vapour which itself acts as a warming agent.
The following graph shows the components, the relative significance of their impact (positive or negative) and the net total result (the dotted black line).
To be clear this is only a small, but vital, component of WGI’s work collating and assessing the physical science of climate change.
The depth of the full report illuminates a huge amount of work from the scientific community.
As part of the current Assessment Report 7 cycle the IPCC has commissioned the Task Force on National Greenhouse Gas Inventories (TFI) to produce the 2027 IPCC Methodology Report on Inventories for Short-lived Climate Forcers (SLCF).
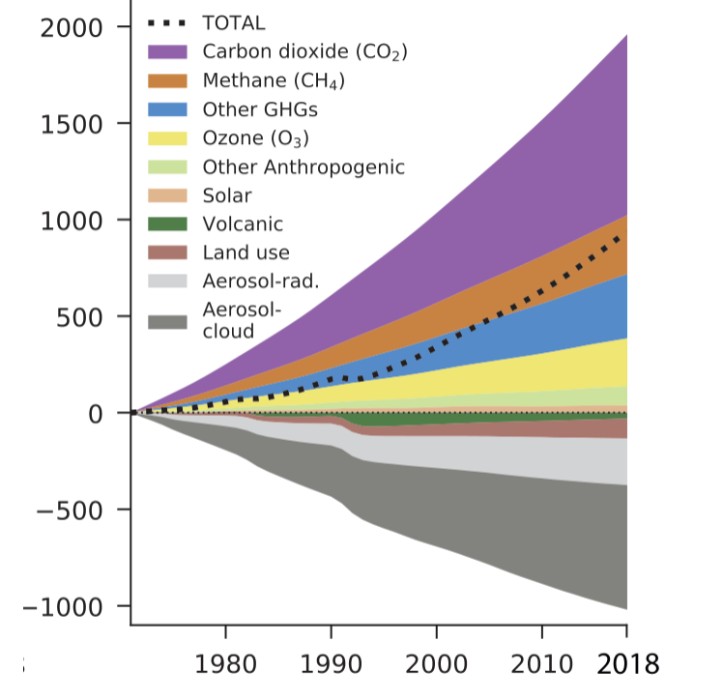
AR6 WGI Technical Summary - Radiative Forcing Components
To be clear this is only a small, but vital, component of WGI’s work collating and assessing the physical science of climate change. The depth of the full report illuminates a huge amount of work from the scientific community.
As part of the current Assessment Report 7 cycle the IPCC has commissioned the Task Force on National Greenhouse Gas Inventories (TFI) to produce the 2027 IPCC Methodology Report on Inventories for Short-lived Climate Forcers (SLCF).
The focus will be developing methodologies to fill gaps in the existing coverage specifically: Nitrogen oxides; Carbon monoxide; Non-methane volatile organic compounds (NMVOCs); Sulphur dioxide; Organic Carbon; “as well as emissions of primary particulate matter [micrometre size] relevant for radiative forcing, as appropriate.”
The Report will produce separate volumes for inventory sectors: Energy, Industrial Process and Product Use (IPPU); Agriculture, Forestry and Other Land Use (AFOLU); and Waste.
A separate volume will focus on cross-cutting issues.
Speaking of waste … Australia’s National waste and resource recovery report 2024 was released in January this year.
The data is for FY 2022-23. At a glance: “During the financial year 2022–23 Australia generated an estimated 75.6 million tonnes (Mt) of waste. This included 26.8 Mt of building and demolition materials, 14.6 Mt of organics, 10.3 Mt of ash, 6.5 Mt of hazardous wastes, 6.0 Mt of metals, 4.9 Mt of paper and cardboard and 3.0 Mt of plastics. This is equivalent to 2.88 tonnes (t) per capita.”
Households and local government activities contributed 13.5 Mt of municipal solid waste I.e. 512 kg per capita and 18% of the total.
On the bright side, the claimed “resource recovery rate” (waste reuse, recycling and energy recovery) was 66%.
In NSW the NSW State of the Environment 2024 Report (June 2025 data also up to 2023) noted that Waste generation is increasing dramatically with landfills servicing Greater Sydney expected to run out of space by 2030.
Commonsense says the recent high population growth and housing construction frenzy won’t slow the dramatic increase.
NEWS